Fall in Love this October in San AntonioOctober in San Antonio is a delightful time to explore the city as it embraces the cooler temperatures and the festive spirit of fall. From cultural festivals

Dated: September 18 2026
Views: 4
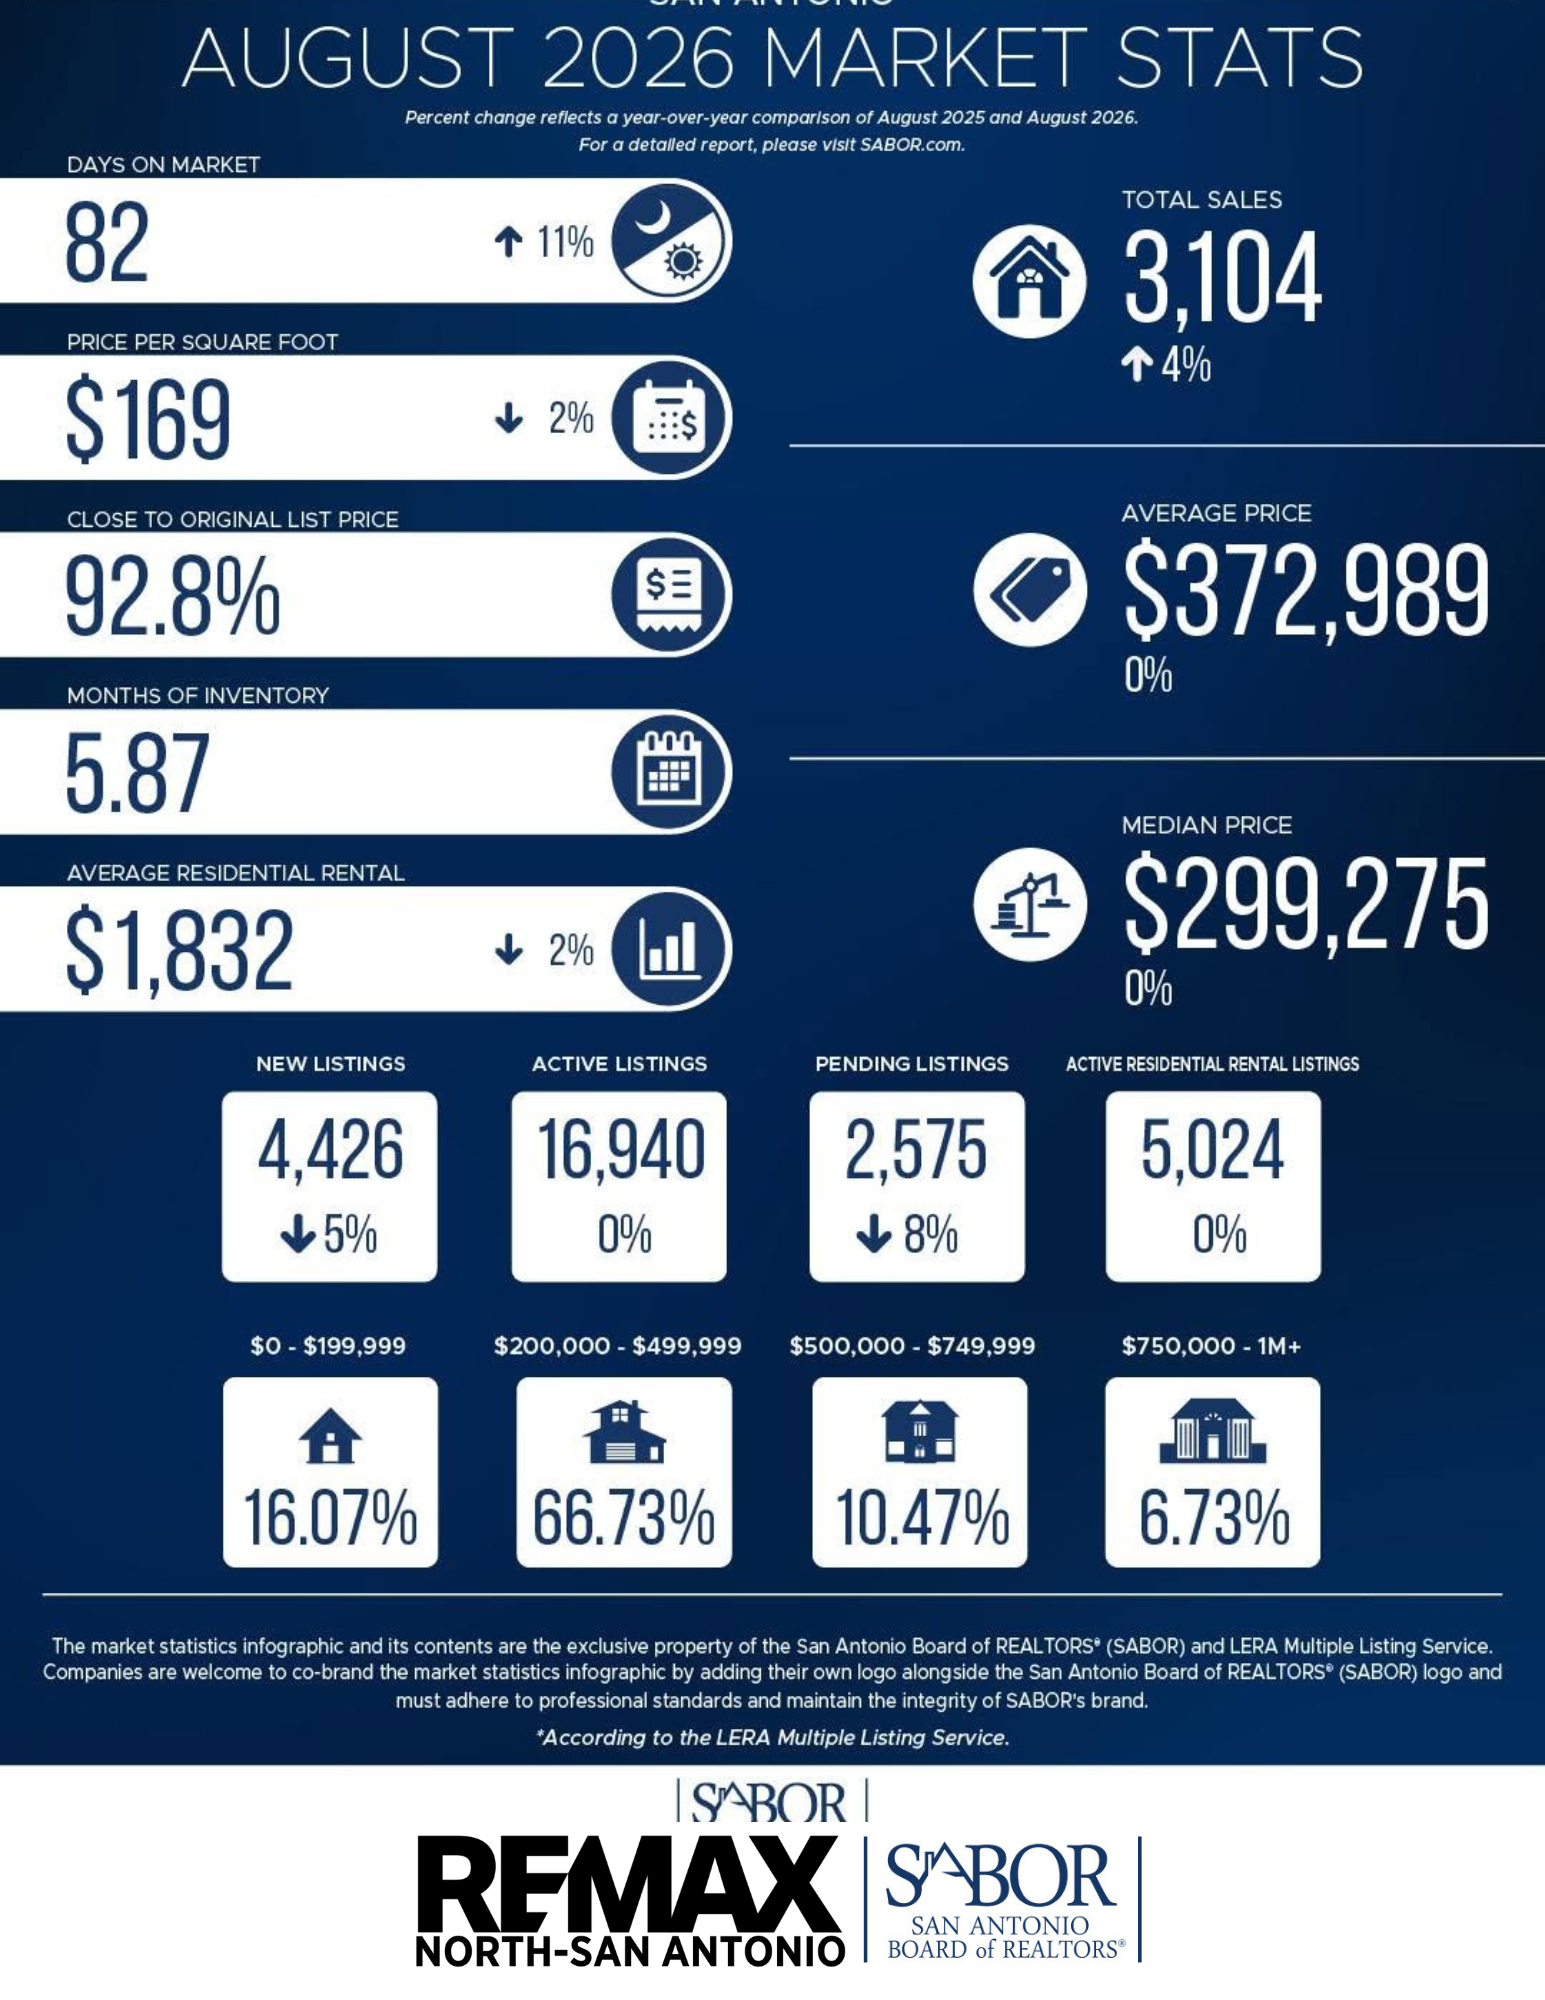
The San Antonio housing market showed a mix of increased sales activity, stable home prices, and longer selling times in August 2026, giving both buyers and sellers important trends to watch as we head into the fall market.
According to the latest market statistics from the San Antonio Board of REALTORS® (SABOR) and LERA Multiple Listing Service, 3,104 homes sold during August, a 4% increase compared with August 2025. Meanwhile, average and median prices remained essentially unchanged year over year. SABOR publishes monthly statistics tracking sales, prices and other housing indicators throughout the San Antonio area. (Sabor)
The average sales price was $372,989, while the median sales price was $299,275. Both were reported as a 0% year-over-year change. The average price per square foot came in at $169, down 2% from last year.
One of the more noticeable changes continues to be the amount of time homes are spending on the market. Days on market increased 11% to 82 days, compared with 74 days in August 2025. (Sabor)
Homes also closed at an average of 92.8% of their original list price, reinforcing the importance of accurate pricing and a strong marketing strategy from the beginning.
San Antonio reported 5.87 months of housing inventory in August. Active inventory totaled 16,940 listings, essentially unchanged year over year.
There were 4,426 new listings, down 5%, while 2,575 listings were pending, an 8% decrease from August 2025.
With homes taking longer to sell and a healthy supply of available properties, buyers may have more opportunity to compare homes, explore different neighborhoods and negotiate terms than they experienced during the much tighter markets of recent years.
The largest share of August home sales continued to fall between $200,000 and $499,999, accounting for 66.73% of sales.
Homes priced below $200,000 represented 16.07% of sales, while homes from $500,000 to $749,999 accounted for 10.47%. Properties priced at $750,000 and above represented 6.73%.
That means more than 82% of August sales occurred below $500,000, highlighting just how important the lower and middle price ranges remain to the San Antonio housing market.
The increase in sales is encouraging, but today's sellers need to recognize that buyers have choices. With an average of 82 days on market, simply putting a home on the market doesn't guarantee a quick sale.
Pricing, condition, presentation and marketing matter. Homes that are positioned correctly from the beginning have a better opportunity to stand out among competing listings. Sellers should also be prepared for negotiations and work with their real estate professional to evaluate comparable properties and current neighborhood-specific conditions.
For buyers, the current market offers something valuable: options and time to make more informed decisions.
More available inventory can create opportunities to compare properties and negotiate on factors beyond price, depending on the home and the seller's circumstances. However, market conditions can vary considerably by neighborhood and price range, so the broader San Antonio statistics are only the starting point.
The average residential rental rate was $1,832 in August, down 2% year over year, while there were 5,024 active residential rental listings.
For renters considering whether it may be time to purchase, comparing the costs and long-term benefits of renting versus homeownership can be a worthwhile conversation—particularly when considering how long you expect to remain in the San Antonio area.
Real estate is local, and even citywide statistics don't tell the complete story of what's happening in a specific neighborhood, community or price range.
Whether you're thinking about buying your first home, moving to the San Antonio area, selling your current property or simply wondering what your home may be worth, the professionals at REMAX North-San Antonio are here to help you understand today's market and your options.
Contact REMAX North-San Antonio today to connect with a local real estate professional and start the conversation.
Market statistics are based on August 2026 data provided by the San Antonio Board of REALTORS® (SABOR) and LERA Multiple Listing Service. Market conditions vary by location, property type and price range. (Sabor)

🌟 Technology & Marketing Coach for REMAX Agents 🌟 I empower agents to thrive using the complete suite of RE/MAX tools: MAXTech, MAXCenter, REMAX University, BoldTrail, Photofy, Canva, agent webs....
Fall in Love this October in San AntonioOctober in San Antonio is a delightful time to explore the city as it embraces the cooler temperatures and the festive spirit of fall. From cultural festivals
San Antonio Housing Market Update – August 2026The San Antonio housing market showed a mix of increased sales activity, stable home prices, and longer selling times in August 2026, giving both
The Best Time To Buy a Home in 2026 Is Almost HereWant to buy a house this year, but not sure if the timing’s right? Seasonally, it may actually be a better time to buy than you expect.Yes,
Selling This Fall? You Want To Get These 4 Things Right.Selling your house this fall is absolutely doable. But there’s something you need to know about this time of year. Buyer activity
Should you require assistance in navigating our website or searching for real estate, please contact our offices at 210-695-4850.
Texas Real Estate Commission Consumer Protection Notice
Each Office Independently Owned and Operated.

We are pledged to the letter and spirit of U.S. policy for the achievement of equal housing opportunity throughout the Nation.
Visit remax.com for all U.S. listings.
 Austin Board of REALTORS® Copyright ©2026 All rights reserved.
33. Required DMCA Notice
The Digital Millennium Copyright Act of 1998, 17 U.S.C. §512, the DMCA, provides recourse for copyright owners who believe that material appearing on the Internet infringes their rights under U.S. copyright law. If you believe in good faith that any content or material made available in connection with our website or services infringes your copyright, you (or your agent) may send us a notice requesting that the content or material be removed, or access to it blocked. Notices must be sent in writing by email to DMCAnotice@MLSGrid.com. The DMCA requires that your notice of alleged copyright infringement include the following information: (1) description of the copyrighted work that is the subject of claimed infringement; (2) description of the alleged infringing content and information sufficient to permit us to locate the content; (3) contact information for you, including your address, telephone number and email address; (4) a statement by you that you have a good faith belief that the content in the manner complained of is not authorized by the copyright owner, or its agent, or by the operation of any law; (5) a statement by you, signed under penalty of perjury, that the information in the notification is accurate and that you have the authority to enforce the copyrights that are claimed to be infringed; and (6) a physical or electronic signature of the copyright owner or a person authorized to act on the copyright owners behalf. Failure to include all of the above information may result in the delay of the processing of your complaint.
 Information provided courtesy of LERA MLS. IDX information is provided exclusively for consumers' personal, non-commercial use and may not be used for any purpose other than to identify prospective properties consumers may be interested in purchasing. Information is believed to be accurate but not guaranteed. Provided courtesy of LERA MLS. Copyright 2026 LERA MLS, All Rights Reserved. Data last updated September 19, 2026 10:28 AM UTC
 South Texas MLS, LLC. All information deemed reliable but not guaranteed. All properties are subject to prior sale, change or withdrawal. Neither listing broker(s) or information provider(s) shall be responsible for any typographical errors, misinformation, misprints and shall be held totally harmless. Listing(s) information is provided for consumer's personal, non-commercial use and may not be used for any purpose other than to identify prospective properties consumers may be interested in purchasing.
The data relating to real estate for sale on this website comes in part from the Internet Data Exchange program of the Multiple Listing Service. Real estate listings held by brokerage firms other than REMAX North - San Antonio may be marked with the Internet Data Exchange logo and detailed information about those properties will include the name of the listing broker(s) when required by the MLS. Copyright of Texas Association of REALTORS®. Reproduction or distribution of data is not allowed.
Show More...
South Texas MLS, LLC. All information deemed reliable but not guaranteed. All properties are subject to prior sale, change or withdrawal. Neither listing broker(s) or information provider(s) shall be responsible for any typographical errors, misinformation, misprints and shall be held totally harmless. Listing(s) information is provided for consumer's personal, non-commercial use and may not be used for any purpose other than to identify prospective properties consumers may be interested in purchasing.
The data relating to real estate for sale on this website comes in part from the Internet Data Exchange program of the Multiple Listing Service. Real estate listings held by brokerage firms other than REMAX North - San Antonio may be marked with the Internet Data Exchange logo and detailed information about those properties will include the name of the listing broker(s) when required by the MLS. Copyright of Texas Association of REALTORS®. Reproduction or distribution of data is not allowed.
Show More...
